Exto

Intel
L&T
Haskell
JE Dunn
ATC
STC
Yotta
BWSSB
Intel
L&T
Haskell
JE Dunn
ATC
STC
Yotta
BWSSB
Intel
L&T
Haskell
JE Dunn
ATC
STC
Yotta
BWSSB
Exto 6 Dimensions Grid with 5 annotated callouts explaining each dimension — what equipment, how installed, which data, when done, linked issues

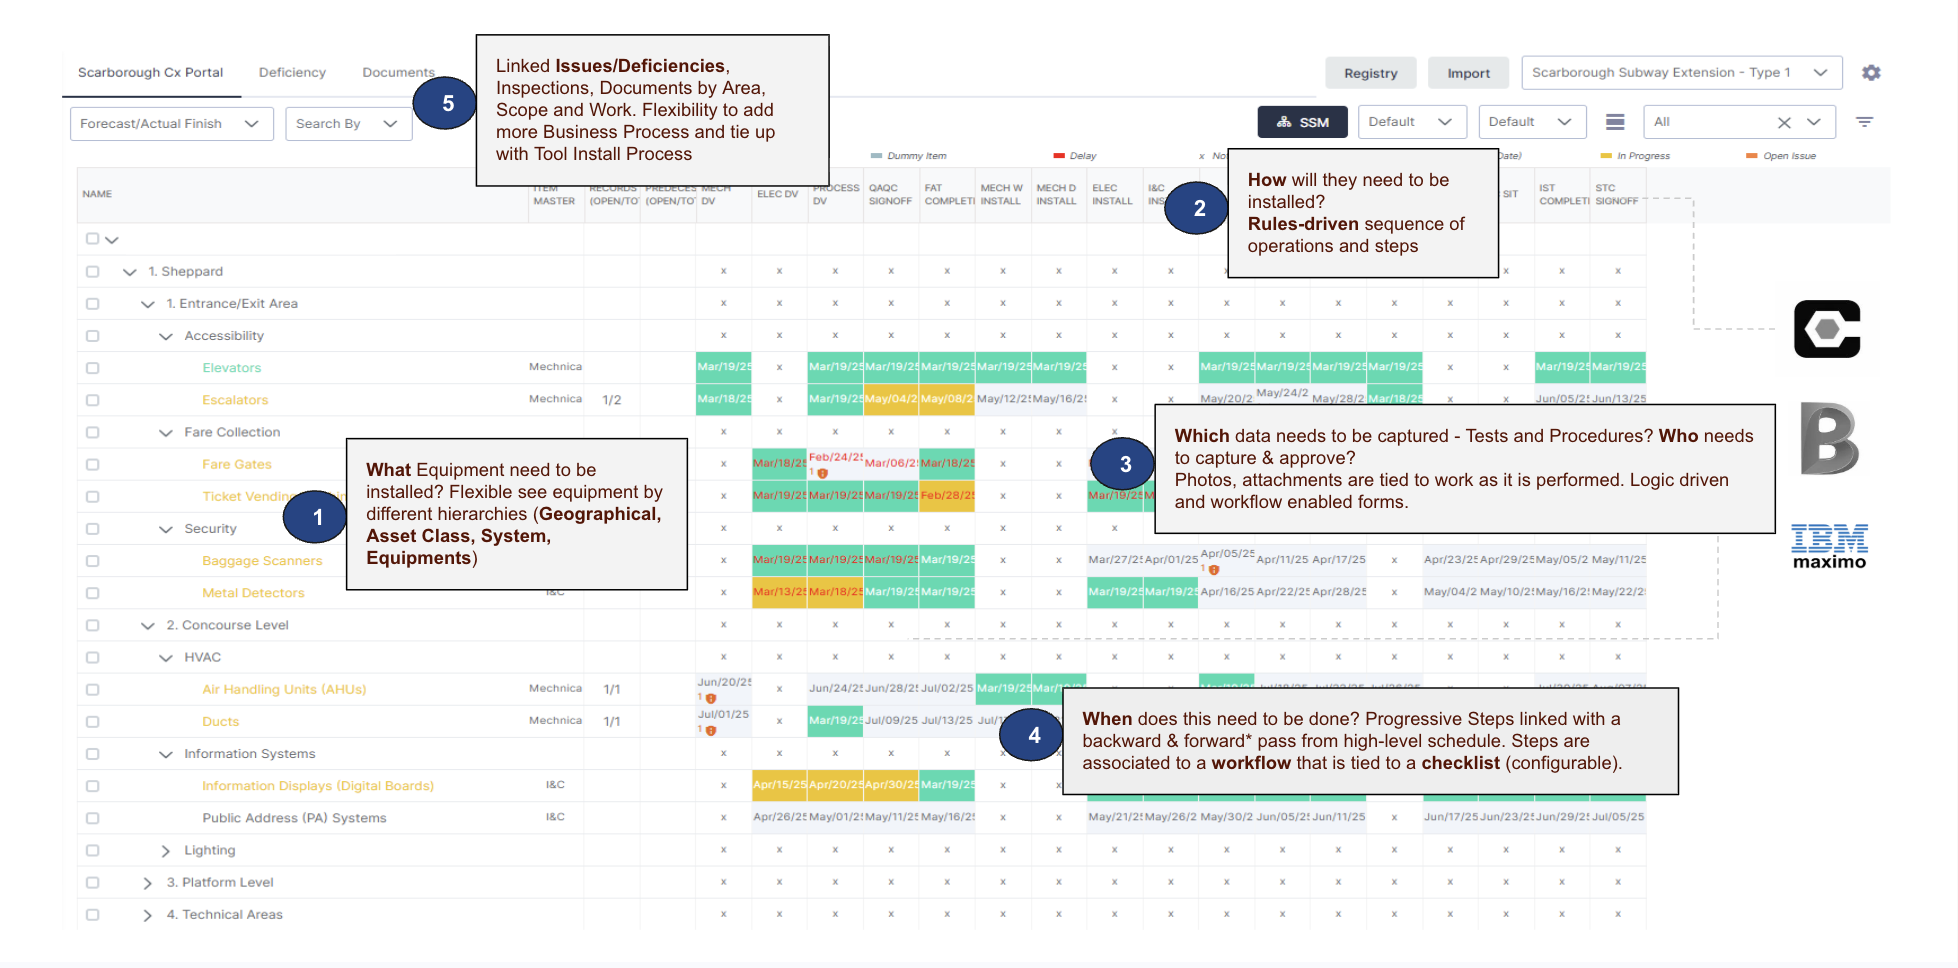
5 Questions Answered in One View

The 6 Dimensions grid answers every critical question about site readiness — from what equipment needs to be installed, to when it needs to be done, all connected to linked issues and deficiencies.

  • What equipment needs to be installed? Flexible hierarchy views
  • How will they need to be installed? Rules-driven sequence of operations
  • Which data needs to be captured? Logic-driven, workflow-enabled forms
  • When does it need to be done? Steps linked to high-level schedule
  • Linked issues — Inspections, documents by area, scope, and work
Exto Cx Portal — equipment grid with hierarchical asset tree showing commissioning step statuses across columns

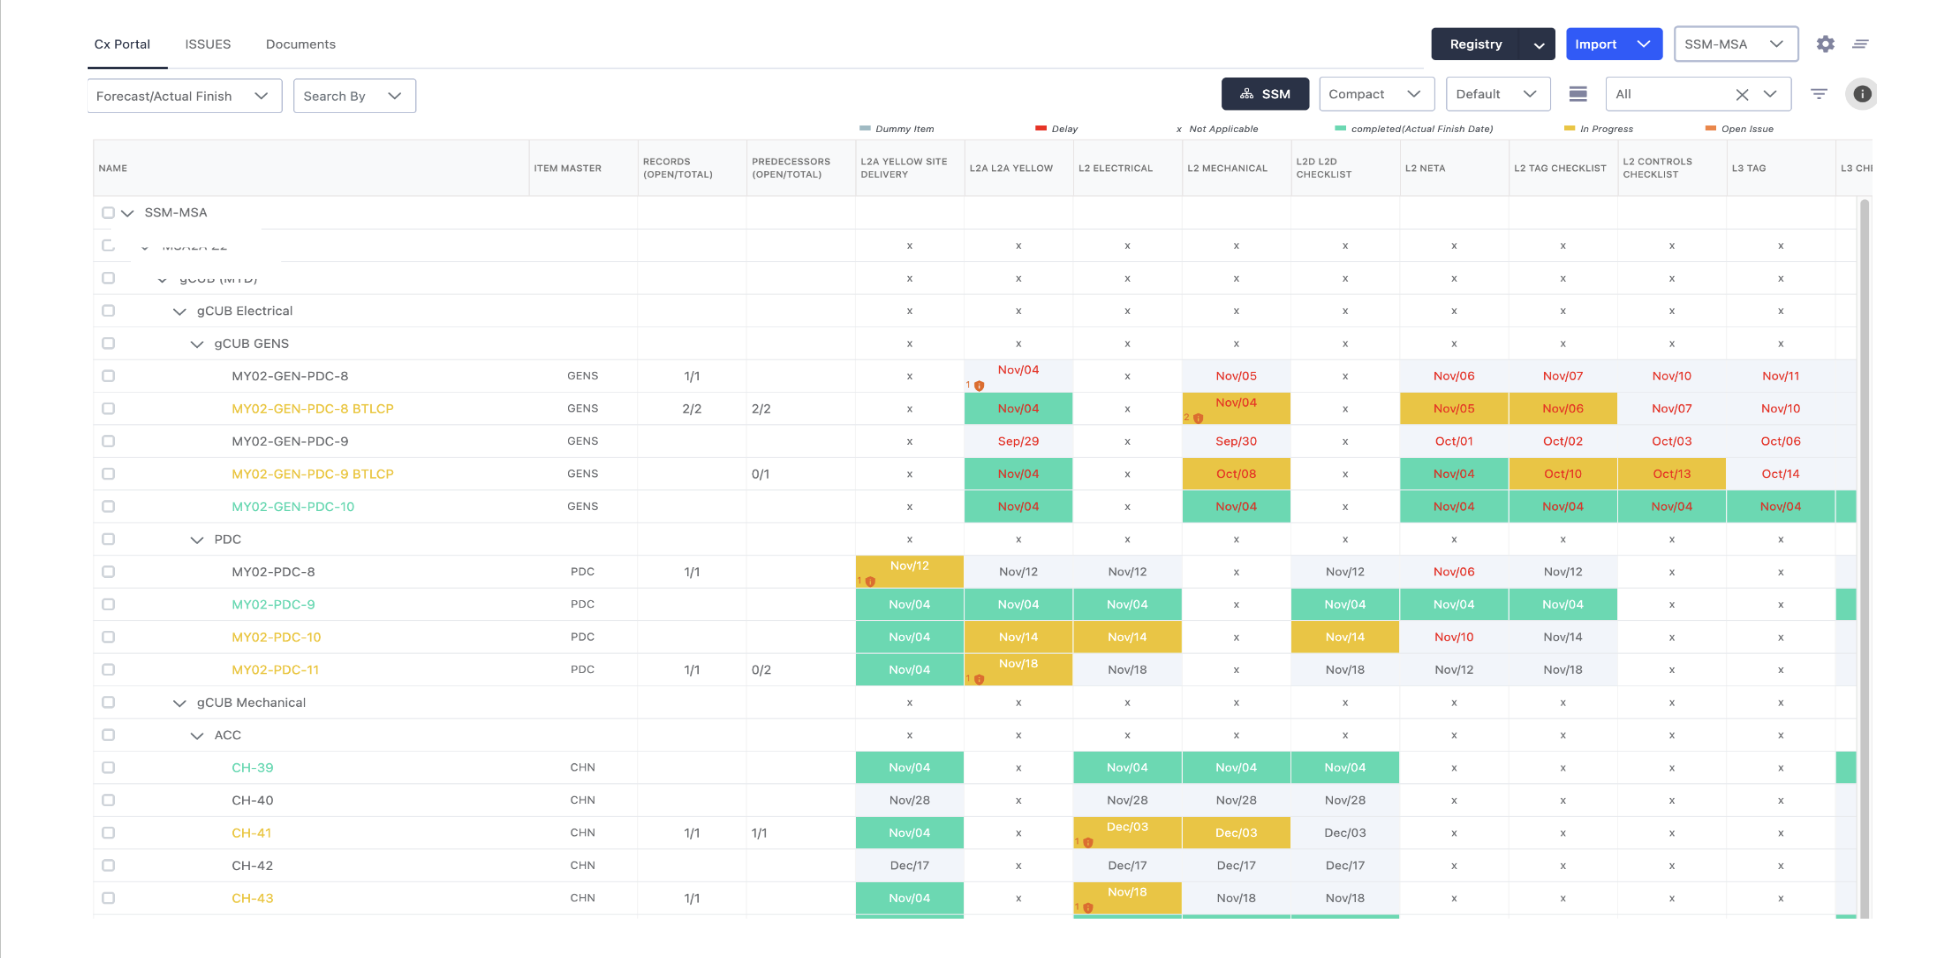
Equipment & Asset Hierarchy

Upload your equipment lists and automatically organize them into flexible hierarchies. Every asset is tracked through its full commissioning sequence with color-coded status visibility.

  • Create digital equipment lists tied to real-time data
  • Organize by Geographical, Asset Class, System, or Equipment type
  • Attach forms and checklists to each piece of equipment
  • Import from drawing schedules, BOMs, and external systems
  • Track predecessors and dependencies between assets
Exto Dashboards — Issues Root Cause analysis, Issue Aging charts, Status Trend lines, CC/GT Ratio Trend, and Issues Count by Status table

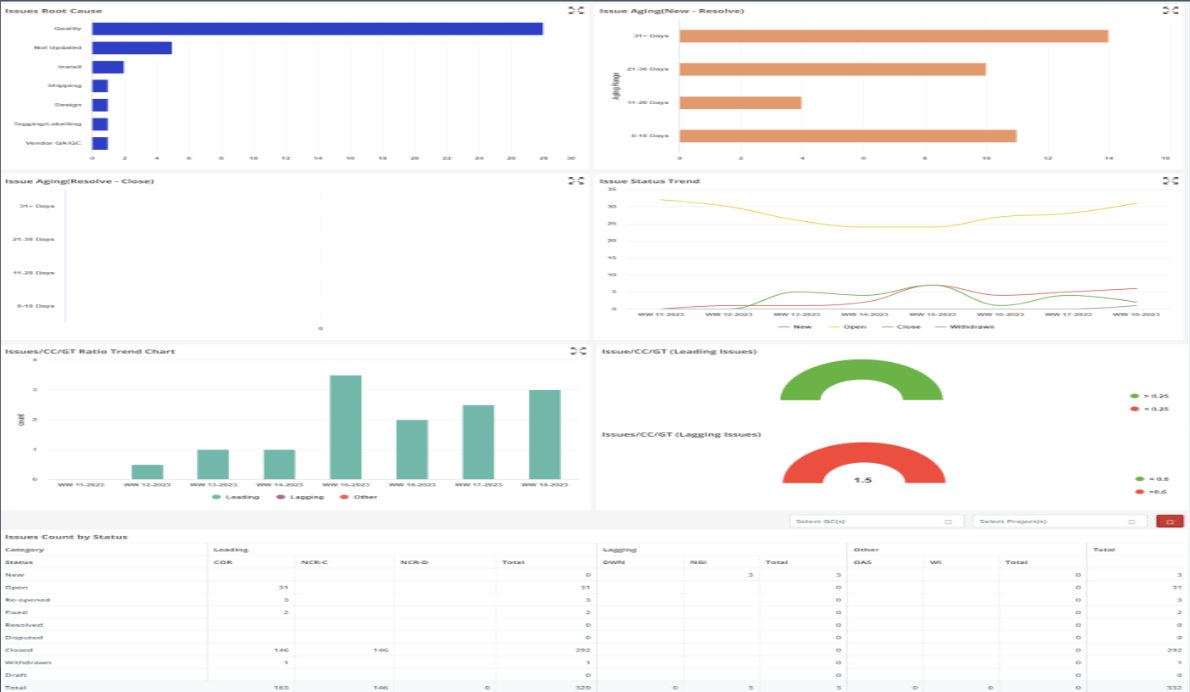
Data Analysis — Dashboards & Reports

Configurable dashboards and reports set up with every site. Real-time data eliminates separate Excel sheets. Step %, PAS, Forecast & Actual comparison — all easily traceable.

  • Issues Root Cause, Aging, Status Trend, and CC/GT Ratio charts
  • Up-to-date information every day on the portal
  • Eliminates separate Excel sheets for project management
  • Scheduled reports auto-delivered to stakeholders
Exto ROI Calculator
roi calculator

What is the true cost of delayed operational readiness?

Enter your project parameters to quantify the impact of commissioning delays — and see how Exto accelerates readiness.

Your Project
Adjust the sliders to match your project scale
$100M$5B
$1M$100M
10 people500+
1 site15 sites
Semiconductor Fab
Data Center
Transit / Infra
EV / Manufacturing
Annual Cost of the Last Mile
$0
Estimated annual cost from delays, rework, and manual coordination without a system of record
Cost Breakdown vs Exto Impact
Delay Cost
Manual Labor Overhead
Rework & Missed Steps
Exto Annual Cost
Net Savings with Exto
30 days
Acceleration Delivered
75%
FAT Error Reduction
$250K
Savings / Site / Year

Trusted where failure isn't an option.

Download Case Study

Get the full case study with detailed outcomes, implementation insights, and ROI analysis.

Your case study is ready!

Click below to download. We’ve also sent a copy to your email.

Download PDF